January 28, 2011
|
28 January 2011
Dear Subscriber There are two reasons to own shares: capital gains and dividends. The beauty of dividends is that they reward you with a steady income while you wait for unpredictable capital gains. In addition, in the very long run, re-invested dividends make up a significant percentage of equities total return, with many studies showing it as more than 50%. Those statistics emphasise how important a role dividends play. We have found dividend yields a useful valuation tool, helping us to identify companies that are undervalued. Many high dividends will be cut, but we only need to identify the few that dont cut, rather increase their dividends over time. I believe a company on a sustainable above average yield that is covered by sustainable profits is a very attractive investment indeed. In Dividend Alerts issue 7 we focused on ways to identify high quality companies. We also briefly touched on the concept of using historic dividend yields and share prices in order to ascertain whether a share price has become historically undervalued or overvalued, or, is somewhere in between. Quick recap: how to recognise high quality companies?In order to identify fundamental high quality companies, we are looking for shares with:
If and when a company meets these criteria it merits further investigation into whether it currently represents good value, or whether it is overvalued, or, somewhere in between. Dividend income but not at any priceAs a long term investor in dividend paying companies, I recognise the benefits of buying dividend paying shares when their share prices are undervalued while the dividend appears not to be in any particular danger. Long term returns depend more than anything on the price you pay then you buy. How? Simply, buy cheap and you will make more money than when you buy dear, because:
In all this, it is important to realise that dividend yields are not static. As share prices fluctuate, so do their current and prospective dividend yields. All things being equal, when a companys share price goes up the dividend yield falls and if the share price goes down the dividend yield increases. Of course, in the meantime, nothing fundamental may have changed with the underlining activities or indeed the profitability of the company itself, just the dividend yield has increased or decreased. This brings us then to the fundamental question: When is the best time to invest? I would suggest, when . . .
When are share prices low?In addition to having spare cash to invest for the long term, the problem for many people is to ascertain whether share prices in general, or, a particular companys share price in particular is, low or high. Until now, we dont know if NOW is the best time to invest in a particular company. Unless you have a working crystal ball, we will never know for sure whether todays share prices are low or high relative to tomorrows price or any other price in the future. In fact, the uncertainty of whether a share price is low or high is the answer to our problem. Here is why . . .
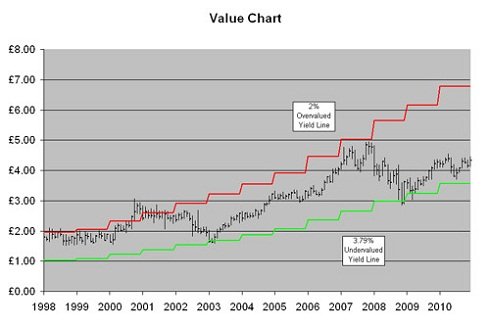
This is quite a problem! Perhaps we should consider a way to determine if and when a company is truly undervalued prior to buying the shares. Undervalue versus overvalueFrom our perspective undervalue is not simply a very low share price. Rather, it represents a situation in which a companys dividend yield is historically high in relation to the bottom of a major share price decline i.e. a currently low share price. Its these types of undervalued companies which warrant further investigation, as outlined above. In comparison, overvalue describes a situation in which a companys share price is priced high with a historically low dividend yield, i.e. the dividend yield is relatively low in relation to the top of a major share price increase. Over longer periods, share prices generally fluctuate between recurring extremes of high dividend yields and low dividend yields. Whats more, dividend yields at undervalue and overvalue tend to be repetitive. Interestingly, over time, repetitive patterns start to appear. Companies with recurring annual dividends show areas of low share prices, with high dividend yields, and high share prices with low dividend yields. Either way, if and when such moments occur, investors should consider action. It is these dividend yield - share price boundaries that we will be using in order to determine whether a company is overvalued or undervalued. When a dividend is cut the share prices at undervalue are also lowered. While, when a dividend is increased its share price at overvalue is improved. A share price that previously was undervalued may now no longer represent good value and vice versa. Our research so far, indicates that each dividend paying company has its own periods when it appears to be undervalued or overvalued or is somewhere in between. Example FTSE100 company
In order for us to calculate the undervalue and overvalue share price boundaries we have used data starting from 1990. Due to the space available, the chart clearly shows escalating dividend yield - share price boundaries, as from 1989, as well as the monthly share prices highs and lows. The line at the top represents a 2 per cent dividend yield, where the share price appears to become overvalued. Once crossed, as it did during the end of 2000, the share price topped, selling overtook buying resulting in a declining share price. The line at the bottom represents a dividend yield of 3.79 per cent where the share price appears to be undervalued. Once crossed, as it did for several months in 2003 and most recently during early 2009 and mid 2010, the share price bottomed before buying overtook selling resulting in a rising share price. The dividend yield - share price boundary lines clearly indicate the historic undervalued entry points and overvalued exit points. Note: when the dividend is raised, the undervalue and overvalue boundaries are adjusted so that they continue to reflect the historically established undervalue and overvalue dividend yield percentages. You may ask: why does this happen?Its actually quite simple . . . When the share price of a dividend paying company declines far enough for it to show an increasingly high dividend yield, investors will notice and start buying. When enough investors step in, the share price decline will stop (the point of maximum undervalue is reached) and the price of the share starts to rise again. The share price reversal attracts more and more investors, pushing the share price higher and higher. The higher the share price increases, the lower the dividend yield becomes and fewer and fewer investors will be tempted to buy the shares. Meanwhile, investors who have bought the shares at (much!) lower price levels start selling to lock in their profits. Once the share price reaches its historic level of overvalue, the dividend yield is no longer attractive enough to secure more investors. Eventually sellers overcome buyers, the share price increase is reversed (the point of maximum overvalue is reached) and the price starts to decline. The decreasing share price attracts more and more sellers trying to safeguard their gains on the way up and the share price continues its road downwards. The share price continues to decline until a sufficiently high dividend yield is reached again that attracts enough new investors to halt the decline. The pattern repeats itself. However. . . An overvalued share price can continue to increase for some time, even past the overvalue price boundary, but the risk of a sudden downturn increases as more and more previous buyers start to sell and the pressure for the share price to decline increases. As the chart above indicates, if and when a company increases its dividend, the share price at undervalue and overvalue point will also rise, creating further room on the upside. Next steps?In the third and final instalment of this article series, started in Dividend Alerts issue 7, we will cover in more detail the FTSE100 company whose chart we show above, putting it all together. As we have now completed a number of FTSE100 companies, in a similar fashion, we have so much confidence in the validity of this investment methodology to time our share buying and selling that we have decided to use it extensively at our subscription-based web-site which we have called: the Dividend Income Investor. Dividend Income Investors investment strategy will focus solely on high quality stock selection listed on both the London Stock Exchange and elsewhere, buying and selling shares when they are undervalued or overvalued based on historic price-yield parameters going forward. As always, we appreciate your feedback. Thank you for reading. Until next time. Kind regards
Steven Dotsch
Know someone who'd like to receive Dividend Alerts themselves? Simply forward this link to anyone you think could benefit from our publication: https://www.early-retirement-investor.com/dividend-alerts.html
Dividend Alerts is an unregulated product published by EMAR Publishing, publishers of Early Retirement Investor.com EMAR Publishing is not registered as an investment advisor or financial advisor. We do not and will not provide personalised investment or financial advice, or individually advocate the purchase or sale of any security or investment. We publish opinionated information about the stock market and companies that we believe our subscribers may be interested in. There is no guarantee that dividends will be paid. Figures are calculated using the closing prices. All gains are gross, and returns will be affected by dividend payments, dealing costs and taxes. Profits from share dealing are a form of income and subject to taxation. Tax treatment depends on individual circumstances and may be subject to change in the future. Editors or contributors may have an interest in shares featured. Past performance and forecasts are not reliable indicators of future performance. Shares are by their nature speculative and can be volatile. Your capital is at risk so you should never invest more than you can safely afford to lose. Information in Dividend Alerts is for general information only and is not intended to be relied upon by individual readers in making (or not making) specific investment or financial decisions. Appropriate independent advice should be obtained before making any such decision. No statement or expression of opinion, or any other matter herein, directly or indirectly, is an offer or the solicitation of an offer to buy or sell the securities or financial instruments mentioned. While we believe the sources of information to be reliable, we in no way represent or guarantee the accuracy of the statements made herein. © 2010 EMAR Publishing. All Rights Reserved. The content of this email may not be reproduced without the written consent of EMAR Publishing Click for Legal Information, Disclaimer and Privacy Statement Here.
|